Top 10 Business Intelligence Trends Zoho Analytics Enhances in 2023
Business intelligence has been completely revolutionized in the past decade. Data has become big and everyone has started using the power of the cloud. The BI landscape is developing and the future of business is now playing a big role.
In 2023, BI tools and strategies will become more and more customized. Businesses of all sizes are not asking if there is a need for increased access to business intelligence analytics but what is the best BI solution for specific needs.
It is best to think of business intelligence as the combination of business analytics, data mining, data visualization, data tools, and infrastructure along with some best practices that can help organizations to make more data-driven decisions. The BI trends coming in the near future are all set to prepare businesses to become more connected, hyper-scale, and data-driven.
In this blog, we will see the top 10 business intelligence trends that Zoho Analytics can help you with within 2023. However, let us first start by gaining a better understanding of what is business intelligence software.
What is Business Intelligence Software?
Business Intelligence software is a tool or an application that is equipped with modern technologies including AI and ML for transforming data into actionable insights without spending any effort. The BI tool can be used for converting raw data into purposeful insights so that it is easy to understand them, use them, and share them for improving business operations.
Business intelligence is essentially about putting your data to use for the purpose of making data-driven decisions. It empowers organizations to make decisions based on data instead of assumptions. A BI tool can be used in the following ways:
1. Understanding Data
You can understand the business data in a much better way using data visualization and finding underlying trends in much lesser time.
2. Analyzing Business Performance
You can measure and monitor business performance in detail along with advanced data analytics technologies while generating actionable insights.
3. Business Growth
Business intelligence software allows you to scale your business to the next level with forecasts on business growth, making timely decisions, and planning your strategies.
Zoho Analytics is a business intelligence software that can help you with crunching large quantities of data, visualizing important data, optimizing business operations, growing a business, cutting down expenses, and getting actionable insights that can be useful for making decisions.
Importance of Business Intelligence
It is important for all businesses to make a good sense of what is happening at a specific point in time and capable business intelligence tools are useful in telling a story. Rather than going by the gut, BI can be helpful in building data-driven organizations. It can be useful for offering valuable and actionable insights into data.
In this period of Big Data, businesses need functional BI software that is capable of solving all kinds of business intelligence needs. BI software is an important component of any business and its processes. The overall effectiveness of BI software is in how simple it can be to deploy, to use and how much value it can offer with hidden insights.
Top 10 Business Intelligence Zoho Analytics Can Help With
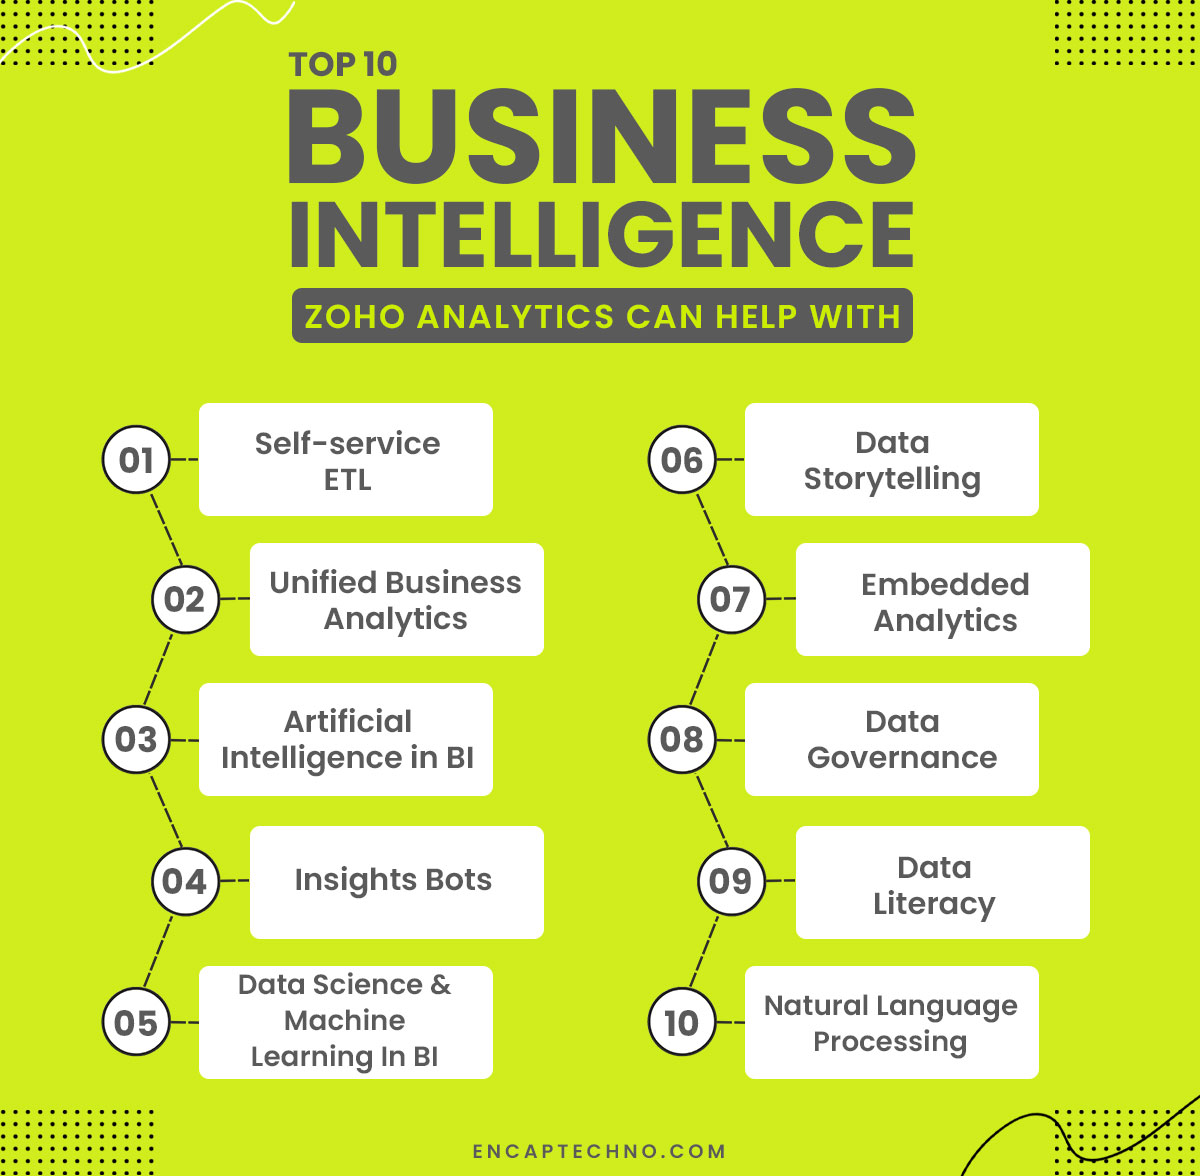
1. Self-service ETL
There was a time when ETL analytics capabilities were only considered to be a luxury for large enterprises. In today’s time, they are supported as a self-serviceable layer within the modern BI workflows democratizing the self-service ETL for all BI users.
In addition, the low-code and no-code interfaces also provide prebuilt capabilities that give users a better start on data transformations. This also enables comprehensive data customization.
The modern ETL layer can be engineered for pro-code users as well so that it supports complex data transformations as lightweight and self-serviceable capabilities. Moreover, BI vendors offer easy cloud data scalability while shouldering data management responsibilities that feel to the user.
2. Unified Business Analytics
As there is an escalation in business app adoption in daily business operations, there is an increasing need for end-to-end analytics that can overcome data silos and offer a comprehensive view of business operations.
Unified business analytics is like the underlining principle with which most businesses can easily blend data from different sources to be analyzed for cross-functional insights. There can be powerful native integrations between analytics platforms and business applications as an important data consolidation effort.
The unified business analytics platforms can also include domain-specific NLP capabilities that can help users to unearth deeper and more powerful insights almost instantly.
3. Artificial Intelligence in BI
AI capabilities are quickly changing across the BI stack. This is valid from the data import stage to sharing of data insights. Capabilities such as automatic data modelling simplify the data preparation at any time when a large volume of raw data gets imported.
In addition to historic analysis, predictive analysis is also gaining quick pace in the market because users are now able to choose from an array of ML-powered and pre-built custom prediction models for the data.
Cognitive analytics is also rising in prominence while bringing powerful and human-like intelligence to the BI workflows with capabilities such as automated insights and recommendations.
Particularly with the use of recommendations, BI platforms are now becoming the main theme and are moving from sharing data insights to guiding the stakeholders through decision-making.
4. Insights Bots
There has been a surge in AI-powered bots in the recent past and the BI world has embraced it massively. The BI bots can interact with users and help them perform operations such as data searches, visualizations, and other computations.
Moreover, the bots also offer tailor-made suggestions with deep ML capabilities while customizing the experience for each and every user. This is the capability that can go a long way in democratizing BI for users at all possible levels.
The BI platforms are also in favor of embedding bots into various channels such as Slack and Microsoft Teams so that they can be natively invoked from application users. The native deployment of an intelligent assistant called Ask Zia in the Slack channel is a common theme.
5. Data Science and Machine Learning In BI
Data science and machine learning capabilities have now become natively available within the BI workflows. These capabilities are relevant to all data scientists and developers who are looking to carry out complex and in-depth data analysis with the deployment of trained ML models.
For this purpose, the self-serviceable AutoML frameworks in modern BI platforms can offer a range of pre-built ML models to give users a better start on the analysis. This capability will instantly find appropriate ML models for being used on the basis of data imported.
The users can also implement custom ML models inside the BI platforms and seamlessly integrate the BI software with the third-party DSML platforms. Significant efforts are being made to ensure that these capabilities continue increasing.
6. Data Storytelling
One of the emerging trends that are opening the BI space to creative communication is called data storytelling. The prime objective is to humanize the overall experience of offering data insights with better context and empathy for stakeholders so that improved data-driven decisions can be taken.
For better data presentation, the BI platforms allow users to make the most out of creative elements such as texts, images, audio, video, and the simple ability to embed code with data stories.
Presentations, website portals, and infographics are popular methods of creating data stories. The data storytelling capabilities are also offered as a part of the business intelligence stack by many popular BI platforms.
7. Embedded Analytics
Embedded analytics has been one of the top business intelligence trends for some time now. The BI vendors can continue to innovate to offer a natural and cohesive BI experience for users anytime they live.
In addition to embedding the BI stack, it is also possible to embed some layers just as needed. Using contextual embedding, users can rebrand their analytics platforms using customizable components that can reflect a brand’s look and feel. These are the components that include logos, CSS customizations, URLs, etc.
A strong suite of APIs can shorten development cycles as embedded analytics is gaining more popularity among independent software vendors looking to embed a BI stack in the software offering.
8. Data Governance
The concept of data governance refers to a set of processes, policies, and roles that ensure appropriate creation, valuation, consumption, and control of business data at a strategic level.
Data governance establishes roles about who can manipulate the data in which situations and with which tools so that everything can be secure and efficient when it comes to data management. Companies of all sizes can be exposed to attacks and breaches while leaving huge amounts of sensitive information from customers, employees, suppliers, etc.
Implementation of a well-crafted governance plan can help organizations in staying compliant with government regulations while also setting the right setting for using quality data and achieving goals.
In the present competitive business environment where the amount of data keeps increasing each second, data governance has become a mandatory practice. A strategically implemented governance framework can assist organizations in staying compliant and minimizing risks, reducing costs, improving communication, and achieving strategic goals.
9. Data Literacy
With data becoming the foundation of strategic decisions for businesses of all sizes, the ability to understand it and use it as a tool in organizations has become important for success. Data literacy will be a relevant data analytics trend to look out for in 2023.
It is best to understand data literacy to understand, read, write, and communicate data in a context. This means understanding the techniques for analyzing data along with the tools implemented. Data literacy is essential for driving success.
Given the rise of self-service tools, data literacy continues to be the foundation of a successful data-driven culture. Business leaders can offer the required training to an organization so that everyone can be empowered to work with data and analytics.
For achieving a successful data literacy process, a detailed assessment of skills should be done to find any gaps. You can start with finding data users as mediators for non-skilled groups and finding communication barriers when data fails its purpose. With this knowledge, the creation of targeted training becomes easy.
10. Natural Language Processing
Natural Language Processing is a trend in business intelligence that is changing the manner in which companies go about their analytical processes. It is a powerful branch of AI that allows computers to understand, learn, and interpret human language in a spoken form.
NLP can be divided into two subsets called natural language understanding and natural language generation. NLU focuses on understanding the meaning of text and speech and NLG focuses on text generation on specific data input.
Businesses have started adopting the technology of NLP for managing big amounts of unstructured text data that is gathered from different sources such as emails, social media, and surveys. Many BI software providers are also offering language insight features to users.
It is safe to say that NLP is a business intelligence trend that is expected to develop in many areas in the coming years. BI software uses the capability of a self-service approach for gaining a competitive edge by offering users a way to conduct efficient analysis without calculations.
Related Read: A Complete Overview of Zoho Analytics
BI Innovation Made Easy with Zoho Analytics
To ensure that continue making the most out of your Zoho Analytics efforts, it is necessary to ensure that emerging trends in the BI market are monitored and strategies are implemented effectively. The BI trends provide an outline of what the future of BI might look like and also offer a strong foundation for implementing BI for your business.
Zoho Analytics is one of the best platforms for implementing BI trends. In case you are not already using the benefits that Zoho Analytics is capable of offering then it is time that you already start doing that. Zoho keeps a consistent watch on emerging customer needs and addresses them for transforming how users analyze data and make decisions.
Top 10 Business Intelligence Trends Zoho Analytics Enhances in 2023 Read More »
Zoho Analytics, Zoho